We build custom, interactive, data dashboards after each of our events. Dashboards help you to determine ROI with charts, graphs, and audience engagement statistics. Follow up tasks are simplified, your data is centralized and custom reports make CRM integration fast and easy.
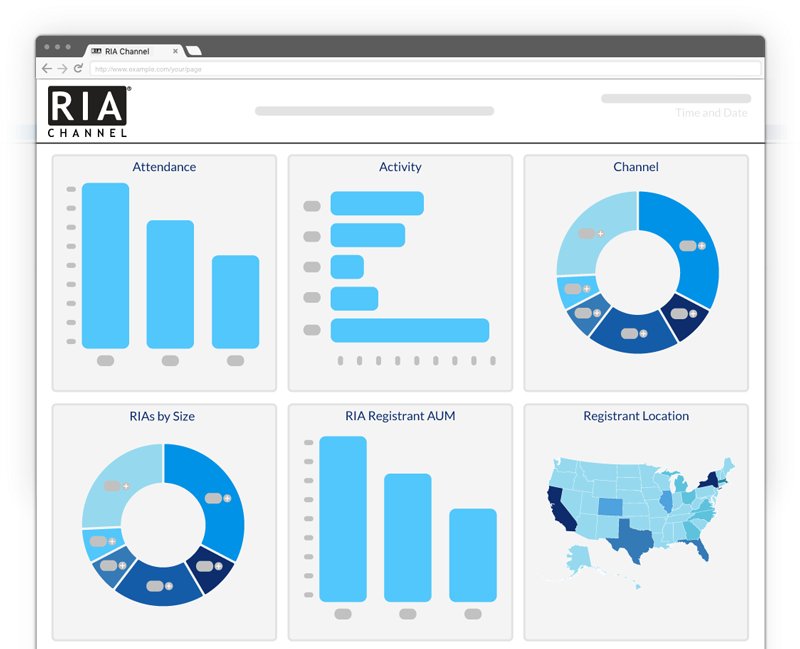
Visualize Your Audience
Segment your audience using interactive tools that allow you to download chart data elements into files based on:
- Channel
- Size
- Geography
- Notable RIA Firms
- Registered Reps by Firm
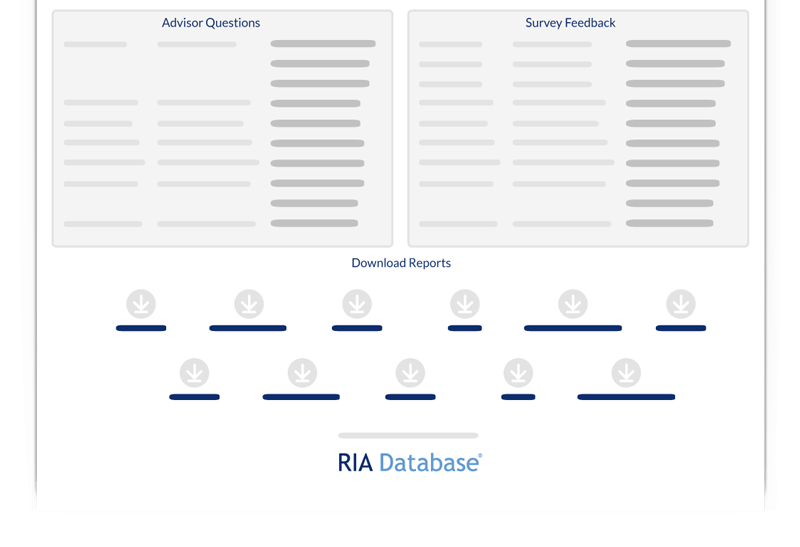
- Questions Asked
- One-On-One Meeting Requests
- Polls
- Survey Results
- Documents Downloaded
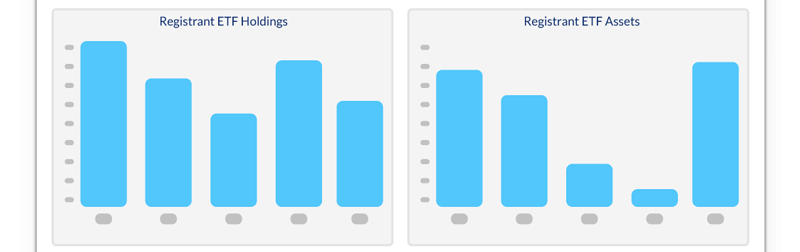
Equity & ETF Holdings & Assets
- By assets
- By shares
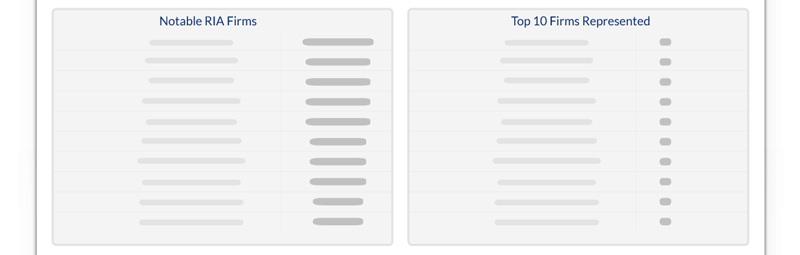
Quick View of Notable Attendees
Get a quick view of some of the more notable webcast attendees, as well as the top 10 firms that were represented by audience members.
Download Data
Files are centralized in your custom dashboards, and any segment of the data may be downloaded into Excel files. CRD numbers are included, and full RIA Database data is appended for all advisors including:
- Full Contact Information
- CRD Number
- Firm Name
- Address
- Phone
- Website
- Assets Under Management
- Assets By Ticker for Equities/ETFs
- Clearing Firm
- Licenses